Note
Go to the end to download the full example code. or to run this example in your browser via Binder
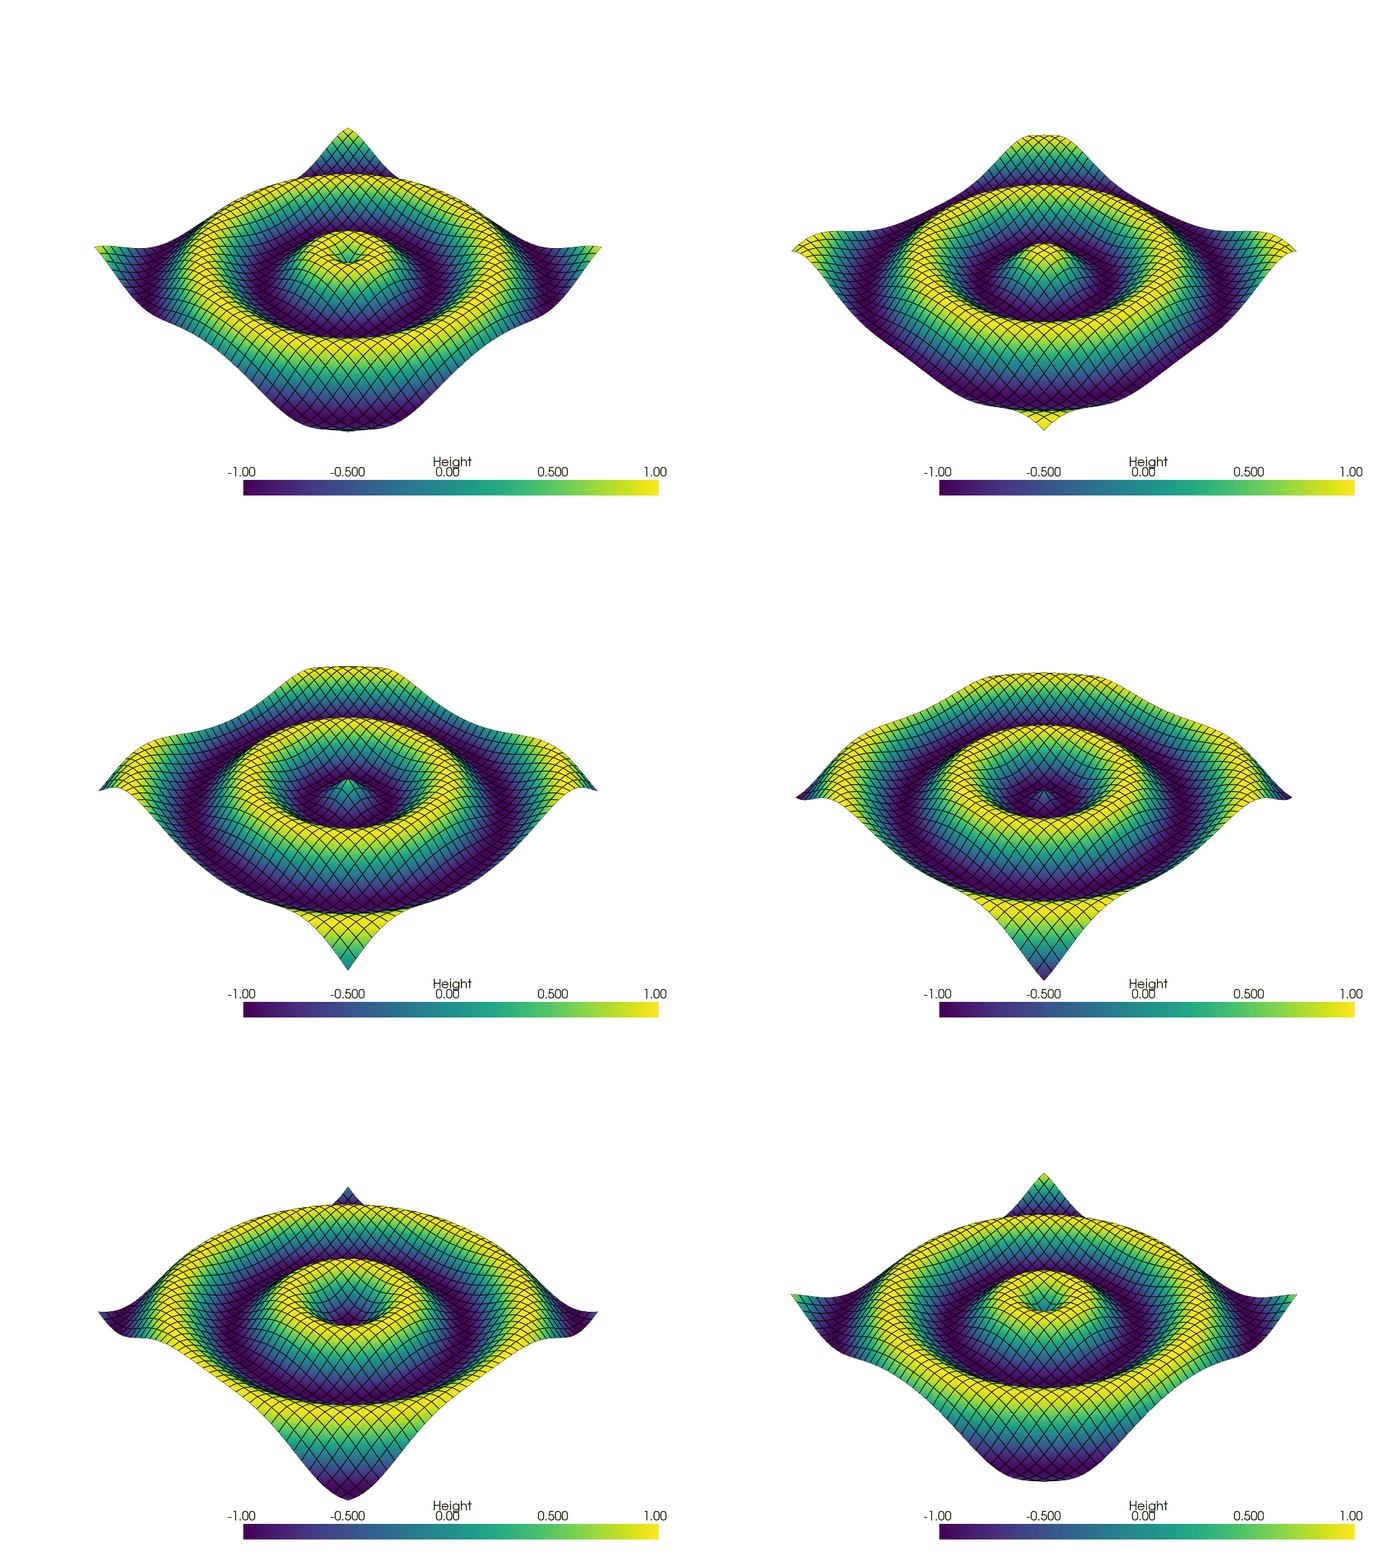
Create a GIF Movie#
Generate a moving gif from an active plotter.
Note
Use lighting=False to reduce the size of the color space to avoid
“jittery” GIFs, especially for the scalar bar.
import numpy as np
import pyvista as pv

x = np.arange(-10, 10, 0.5)
y = np.arange(-10, 10, 0.5)
x, y = np.meshgrid(x, y)
r = np.sqrt(x**2 + y**2)
z = np.sin(r)

# Create and structured surface
grid = pv.StructuredGrid(x, y, z)

# Create a plotter object and set the scalars to the Z height
plotter = pv.Plotter(notebook=False, off_screen=True)
plotter.add_mesh(
    grid,
    scalars=z.ravel(),
    lighting=False,
    show_edges=True,
    scalar_bar_args={"title": "Height"},
    clim=[-1, 1],
)

# Open a gif
plotter.open_gif("wave.gif")

pts = grid.points.copy()

# Update Z and write a frame for each updated position
nframe = 15
for phase in np.linspace(0, 2 * np.pi, nframe + 1)[:nframe]:
    z = np.sin(r + phase)
    pts[:, -1] = z.ravel()
    plotter.update_coordinates(pts, render=False)
    plotter.update_scalars(z.ravel(), render=False)

    # Write a frame. This triggers a render.
    plotter.write_frame()

# Closes and finalizes movie
plotter.close()

/home/runner/.virtualenvs/.venv/lib/python3.10/site-packages/pyvista/plotting/plotter.py:4872: PyVistaDeprecationWarning: This method is deprecated and will be removed in a future version of PyVista. Directly modify the points of a mesh in-place instead.
  warnings.warn(
/home/runner/.virtualenvs/.venv/lib/python3.10/site-packages/pyvista/plotting/plotter.py:4796: PyVistaDeprecationWarning: This method is deprecated and will be removed in a future version of PyVista. Directly modify the scalars of a mesh in-place instead.
  warnings.warn(
Total running time of the script: (0 minutes 2.095 seconds)
